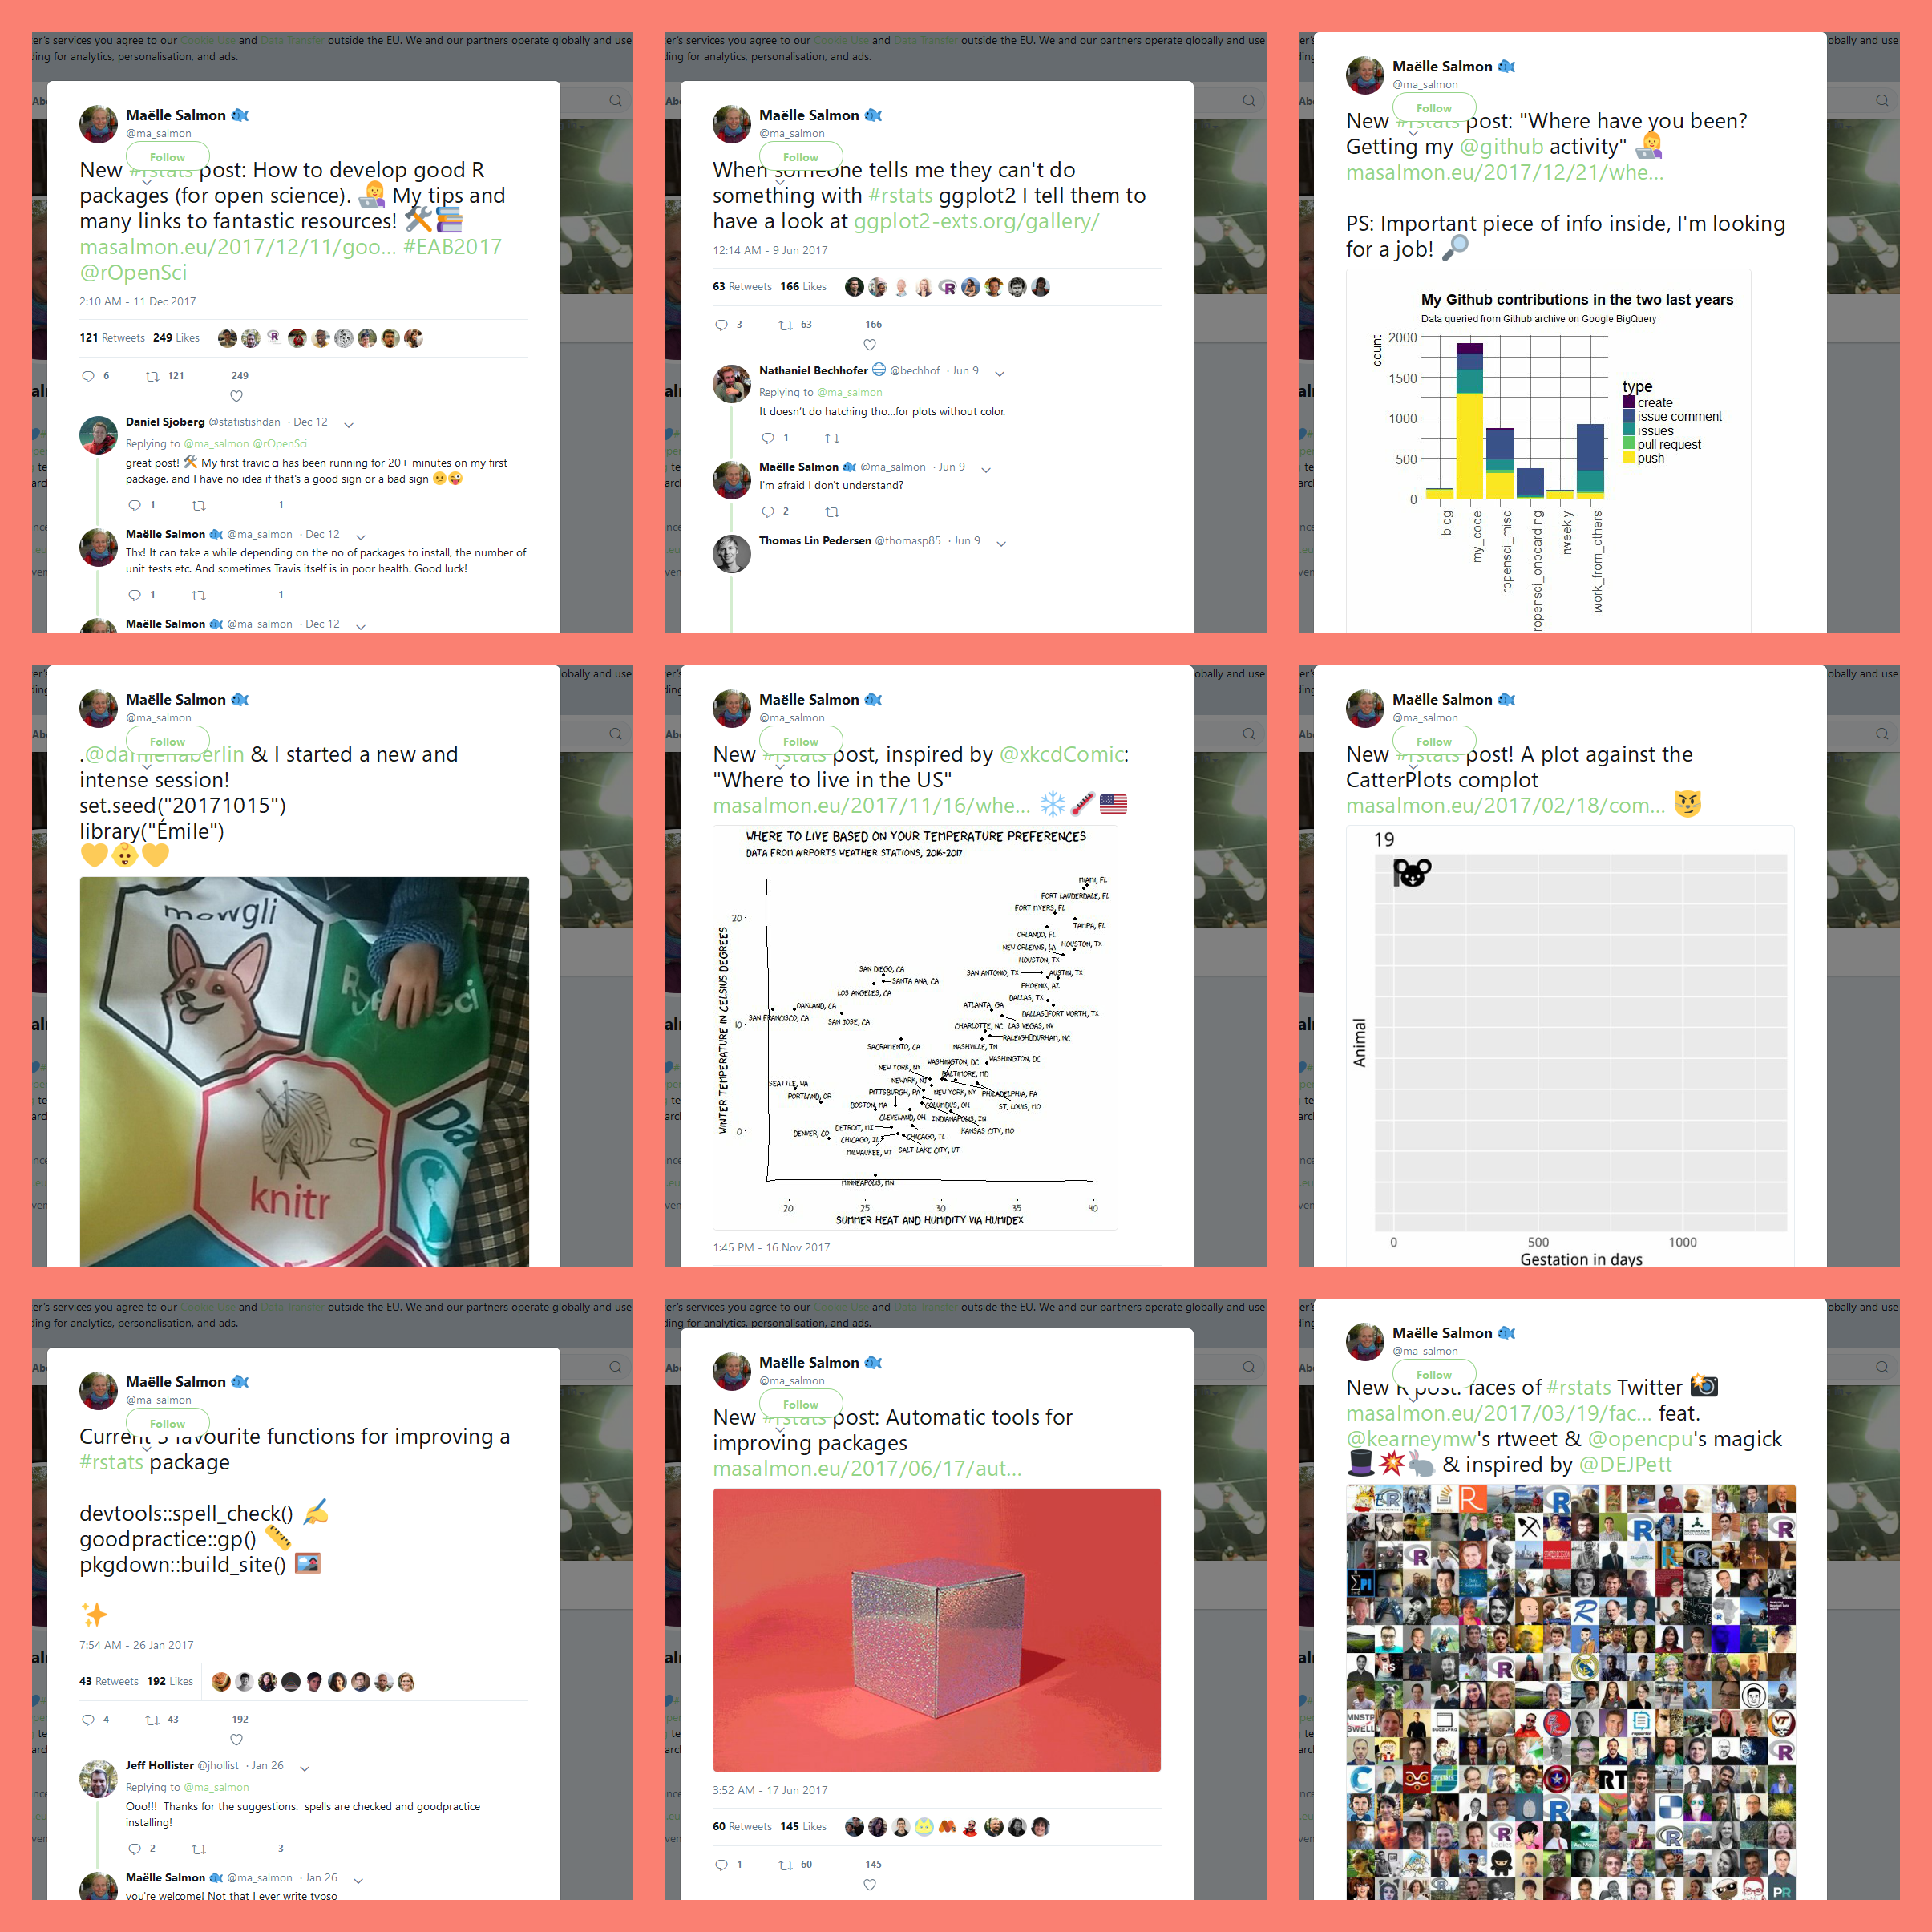
You’ve probably seen people posting their #Best9of2017, primarily on Instagram I’d say. I’m not an Instagram user, although I do have an account to spy on my younger sister and cousins, so I don’t even have 9 Instagram posts in total but I do love the collage people get to show off… So what about my best 9 tweets of 2017?
Get my 9 best tweets by number of likes
I first wanted to use rtweet::get_timeline but it only returned me tweets from July, even when using include_rts = FALSE, so I downloaded my analytics files from the Twitter website, one per trimester.
Edited on the 2018-01-01 to add: If you haven’t tweeted too much,rtweet::get_timeline can be enough, this is what I used for R-Ladies Global version. If it isn’t, here are more precise guidelines by Andrew Caines: " first: download 4 tweet analytics files for 2017 quarters which means, go to: https://analytics.twitter.com then: click on ‘Tweets’ tab at top, change date range top right, ‘export data’ (x4)”.
my_files <- c("tweet_activity_metrics_ma_salmon_20170101_20170402_en.csv",
              "tweet_activity_metrics_ma_salmon_20170402_20170702_en.csv",
              "tweet_activity_metrics_ma_salmon_20170702_20171001_en.csv",
              "tweet_activity_metrics_ma_salmon_20171001_20171231_en.csv")
paths <- paste0("data/", my_files)
# read them all at once
my_tweets <- purrr::map_df(paths, readr::read_csv)
# just in case I got some data ranges wrong
my_tweets <- unique(my_tweets)
# get the top 9!
my_tweets <- dplyr::arrange(my_tweets, - likes)
my_tweets <- janitor::clean_names(my_tweets)

best9 <- my_tweets$tweet_permalink[1:9]
My husband advised me to use something more elaborate than number of likes, which is a wise idea, but I was happy with that simple method.
Take screenshots and paste them
There’s a great R package to do screenshots from R, webshot. I was a bit annoyed at the “Follow” button appearing, but I did not want to have to write Javascript code to first login in the hope to make that thing disappear. I tried using a CSS selector instead of a rectangle, but I was less satisfied. An obvious problem here is that contrary to Instagram images, tweets have different heights depending on the text length and on the size of the optional attached media… It’s a bit sad but not too sad, my collage will still give a look at my Twitter 2017.
library("magrittr")

save_one_file <- function(url, name){
  filename <- paste0(name, ".png")
  # save and output filename
  webshot::webshot(url, filename,
                  cliprect = c(0, 150, 750, 750))
  filename
}

files <- purrr::map2_chr(best9, 1:9, save_one_file)
Regarding the collage part using magick, I used my “Faces of R” post as a reference, which is funny since it features in my top 9 tweets.
no_rows <- 3
no_cols <- 3

make_column <- function(i, files, no_rows){
  filename <- paste0("col", i, ".jpg")

  magick::image_read(files[(i*no_rows+1):((i+1)*no_rows)]) %>%
  magick::image_border("salmon", "20x20") %>%
  magick::image_append(stack = TRUE) %>%
    magick::image_write(filename)

  filename
}

purrr::map_chr(0:(no_cols-1), make_column, files = files,
    no_rows = no_rows) %>%
  magick::image_read() %>%
magick::image_append(stack = FALSE) %>%
  magick::image_border("salmon", "20x20") %>%
  magick::image_write("2017-12-30-best9of2017.jpg")
And since I’m well behaved, I clean after myself.
# clean
file.remove(files)
file.remove(paste0("col", 0:2, ".jpg"))

So, apart from fun blog posts (Where to live in the US, Faces of #rstats Twitter, A plot against the CatterPlots complot) and more serious ones (Automatic tools for improving R packages, How to develop good R packages (for open science), Where have you been? Getting my Github activity), my top 9 tweets include a good ggplot2 tip (this website) and above all, the birth of baby Émile! Why have I only included two heart emojis?
Note: this collage should have been appended the other way round (rows then columns) to correspond to what Instagram produces. Thanks Andrew Caines for telling me!
What about your 2017?
I’ve now read a few awesome end-of-the-year posts from other R bloggers, from the top of my head:
-
Bob Rudis posted an impressive review of his year on Stack Overflow, Github and Twitter, and even made it reproducible for you to make it with your own data!
-
Mara Averick posted her top 2 tweets by month. Note of them praises Mara so let’s remind everyone she’s the greatest curator of R content ever, and recently became a tidyverse advocate for RStudio!
-
Thomas Lin Pedersen looked back on his fantastic 2017.
-
Kasia Kulma’s end of year thoughts include an inspiring description of her journey this year and awesome productivity tips for R bloggers.
What’s your take on your 2017, dear reader? In any case, I wish you a happy New Year!